最近狗哥为了挣钱,专研了一阵股票基金投资策略。虽然之前也有投资,但都是随缘。正好网站前景几乎没有了,并且大部分时间都被小孩占用,只能将所剩不多的精力投入另一种爱好中。
均线又称快速移动平均线,根据不同周期计算出来的有不同的名字,大家熟知的有5日均线,10日均线等等,均线反映了周期内价格波动变化,一定程度上指示了当今价格是否值得投资。定投很好理解,就是在周期内固定投入,结合均线得到均线定投策略。
下面是本次回测使用的具体均线定投策略
复制
# 定投倍数与均线关系的参数
discount_params = [
    {'threshold': 0.875, 'discount': 4},  # 低于均线12.5%,投入4倍定投金额
    {'threshold': 0.9, 'discount': 3.75},  # 低于均线10%,投入3.75倍定投金额
    {'threshold': 0.925, 'discount': 3.5},  # 低于均线7.5%,投入3.5倍定投金额
    {'threshold': 0.95, 'discount': 3},  # 低于均线5%,投入3倍定投金额
    {'threshold': 0.975, 'discount': 2},  # 低于均线2.5%,投入2倍定投金额
    {'threshold': 1.0, 'discount': 1.0},  # 高于均线0%,投入1倍定投金额
    {'threshold': 1.05, 'discount': 0.8},  # 高于均线5%,投入0.8倍定投金额
    {'threshold': 1.1, 'discount': 0.6},  # 高于均线10%,投入0.6倍定投金额
    {'threshold': 1.2, 'discount': 0.5},  # 高于均线20%,投入0.5倍定投金额
    {'threshold': 1.3, 'discount': 0.4},  # 高于均线30%,投入0.4倍定投金额
    {'threshold': 2, 'discount': 0},  # 高于均线200%,不投
]
另外,为了增强对波动的抵抗,即降低回测,设置止盈,每次收益达到5%就卖掉一半仓位。
详细代码如下
复制
import baostock as bs
import pandas as pd
import numpy as np
import matplotlib.pyplot as plt
from datetime import datetime
import matplotlib.dates as mdates

d = 30
mv = "ma" + str(d)

# 登录baostock
lg = bs.login()
if lg.error_code != '0':
    print("登录失败:" + lg.error_msg)
    exit()

# 获取沪深300指数的日K数据
hs300_code = "sh.000300"
start_date = "2020-01-01"
end_date =   "2025-05-31"
rs = bs.query_history_k_data_plus(hs300_code,
    "date,code,close",
    start_date=start_date, end_date=end_date,
    frequency="d", adjustflag="3")

if rs.error_code != '0':
    print("获取数据失败:" + rs.error_msg)
    exit()

# 将数据转换为DataFrame
data = rs.get_data()
data['date'] = pd.to_datetime(data['date'])
data = data.set_index('date')
data['close'] = data['close'].astype(float)

# 计算均线
data[mv] = data['close'].rolling(window=d).mean()

# 定投倍数与均线关系的参数
discount_params = [
    {'threshold': 0.875, 'discount': 4},  # 低于均线12.5%,投入4倍定投金额
    {'threshold': 0.9, 'discount': 3.75},  # 低于均线10%,投入3.75倍定投金额
    {'threshold': 0.925, 'discount': 3.5},  # 低于均线7.5%,投入3.5倍定投金额
    {'threshold': 0.95, 'discount': 3},  # 低于均线5%,投入3倍定投金额
    {'threshold': 0.975, 'discount': 2},  # 低于均线2.5%,投入2倍定投金额
    {'threshold': 1.0, 'discount': 1.0},  # 高于均线0%,投入1倍定投金额
    {'threshold': 1.05, 'discount': 0.8},  # 高于均线5%,投入0.8倍定投金额
    {'threshold': 1.1, 'discount': 0.6},  # 高于均线10%,投入0.6倍定投金额
    {'threshold': 1.2, 'discount': 0.5},  # 高于均线20%,投入0.5倍定投金额
    {'threshold': 1.3, 'discount': 0.4},  # 高于均线30%,投入0.4倍定投金额
    {'threshold': 2, 'discount': 0},  # 高于均线200%,不投
]

# 初始化定投金额和持仓信息
total_investment = 0
total_shares = 0
total_shell = 0
monthly_investment_base = 1000  # 基础每月定投金额
target_profit_rate = 0.05  # 目标收益率
sell_ratio = 0.5  # 卖出比例
last_sell_price = None  # 上一次卖出价格
last_sell_month = None  # 上一次卖出的月份
last_sell_year = None  # 上一次卖出的年份

# 模拟月定投
investment_records = []
last_month = None
return_rates = []  # 用于存储每个时间点的收益率
for date, row in data.iterrows():
    current_year = date.year
    current_month = date.month
    current_day = date.day

    if last_month is None or current_month != last_month or current_day == 1:
        last_month = current_month

        #定投
        discount = 1.0
        for param in discount_params:
            if row['close'] < row[mv] * param['threshold']:
                discount = param['discount']
                break
        dynamic_investment = monthly_investment_base * discount
        total_investment += dynamic_investment
        total_shares += dynamic_investment / row['close']
        investment_records.append((date, dynamic_investment, 'buy'))

        # 检查是否达到目标收益率
        current_value = total_shares * row['close']
        if total_investment > 0:
            rate=(current_value -(total_investment-total_shell) ) / (total_investment)
        else:
            rate = 0
        if total_investment > 0 and rate >= target_profit_rate:
            #卖出
            sell_shares = total_shares * sell_ratio
            total_shares -= sell_shares
            sell_amount = sell_shares * row['close']
            total_shell += sell_amount

            investment_records.append((date, -sell_amount, 'sell'))
            last_sell_price = row['close']
            last_sell_month = current_month
            last_sell_year = current_year

        # 计算当前收益率
        current_return_rate = ((total_shares * row['close'] + total_shell) - total_investment) / total_investment * 100
        return_rates.append((date, current_return_rate))

# 计算最终持仓价值
final_value = total_shares * data.iloc[-1]['close']

# 打印结果
print(f"总定投资金: {total_investment}")
print(f"总持仓股数: {total_shares}")
print(f"最终持仓价值: {final_value}")
print(f"收益率: {(((final_value + total_shell) - total_investment) / total_investment) * 100:.2f}%")

# 设置中文字体
plt.rcParams['font.sans-serif'] = ['SimHei']  # 使用黑体
plt.rcParams['axes.unicode_minus'] = False  # 正确显示负号

# 绘制图表
fig, ax1 = plt.subplots(figsize=(14, 7))

# 绘制沪深300指数和均线
ax1.plot(data.index, data['close'], label='沪深300指数')
ax1.plot(data.index, data[mv], label=mv, color='blue')
ax1.set_xlabel('日期')
ax1.set_ylabel('收盘价')
ax1.legend(loc='upper left')

# 创建共享x轴的第二个坐标轴
ax2 = ax1.twinx()
ax2.set_ylabel('收益率')

# 绘制收益率曲线
return_rate_dates = [mdates.date2num(date) for date, _ in return_rates]
return_rates_values = [rate for _, rate in return_rates]
ax2.plot(return_rate_dates, return_rates_values, label='收益率曲线', color='orange')
ax2.legend(loc='upper right')

# 转换datetime为matplotlib的日期格式
dates = [mdates.date2num(date) for date, _, _ in investment_records]
closes = [data.loc[date, 'close'] for date, _, _ in investment_records]
investments = [investment for _, investment, _ in investment_records]
types = [typ for _, _, typ in investment_records]

# 绘制定投点和卖点
buy_dates = [date for date, investment, typ in investment_records if typ == 'buy']
buy_closes = [data.loc[date, 'close'] for date, investment, typ in investment_records if typ == 'buy']
buy_investments = [investment for date, investment, typ in investment_records if typ == 'buy']

sell_dates = [date for date, investment, typ in investment_records if typ == 'sell' or typ == 'additional_sell']
sell_closes = [data.loc[date, 'close'] for date, investment, typ in investment_records if typ == 'sell' or typ == 'additional_sell']
sell_investments = [investment for date, investment, typ in investment_records if typ == 'sell' or typ == 'additional_sell']

ax1.scatter(buy_dates, buy_closes, color='green', label='买入点')
ax1.scatter(sell_dates, sell_closes, color='red', label='卖点')

# 在每个买入点和卖点添加文本标签
for date, investment in zip(buy_dates, buy_investments):
    ax1.annotate(f'{investment:.2f}', (date, buy_closes[buy_dates.index(date)]), textcoords="offset points", xytext=(0,10), ha='center', color='green')
for date, investment in zip(sell_dates, sell_investments):
    ax1.annotate(f'{investment:.2f}', (date, sell_closes[sell_dates.index(date)]), textcoords="offset points", xytext=(0,-15), ha='center', color='red')

# 设置日期格式
ax1.xaxis.set_major_formatter(mdates.DateFormatter('%Y-%m-%d'))
ax1.xaxis.set_major_locator(mdates.AutoDateLocator())

# 在图表上添加总投入和收益率
ax1.text(data.index[-1], data['close'].max(), f'总定投资金: {total_investment:.2f}\n最终持仓:{final_value:.2f}\n套现:{total_shell:.2f}\n收益:{((final_value + total_shell) - total_investment):.2f}\n收益率: {(((final_value + total_shell) - total_investment) / total_investment) * 100:.2f}%', ha='right', va='top', fontsize=10, color='blue')

plt.title(f'沪深300指数与{d}日均线')
plt.grid(True)
plt.show()

# 登出baostock
bs.logout()
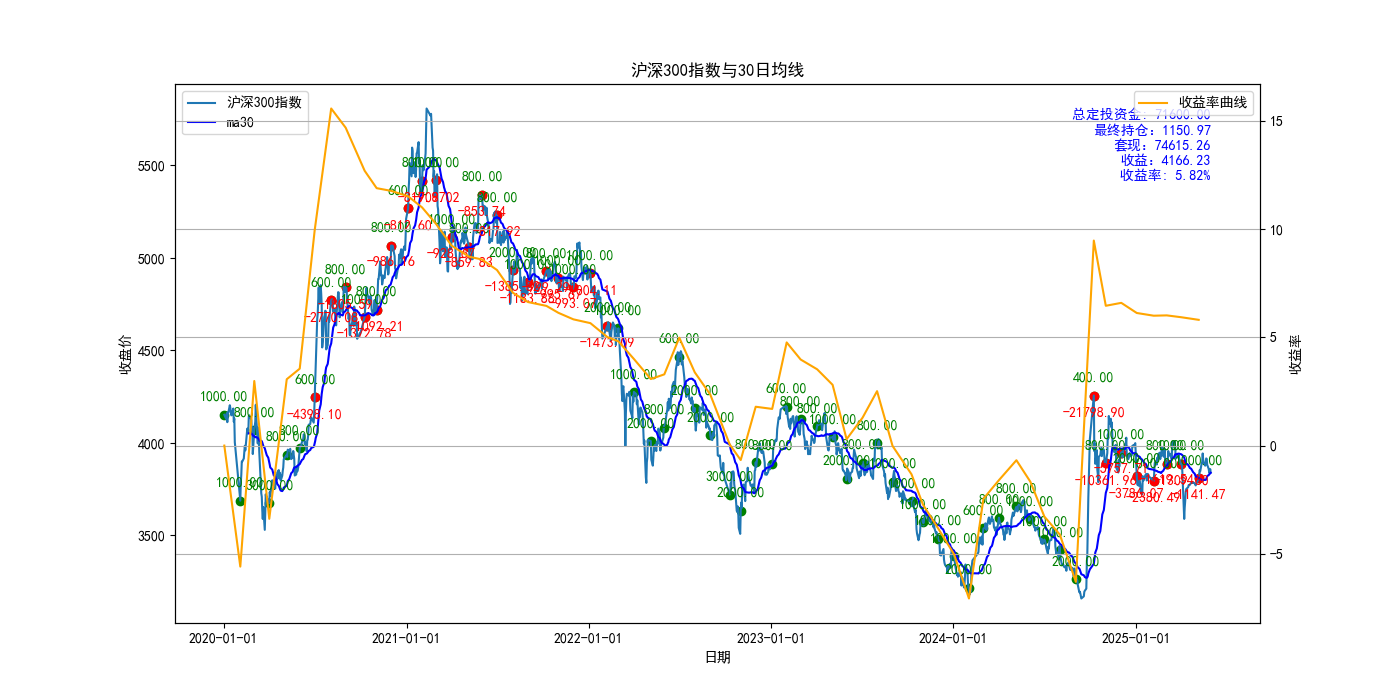
上面的代码演示了,使用30日均线作为投资参考,2020-01-01到2025-05-31,每月第一个交易日,定投1000元,沪深三百的均线定投回测效果,最终的效果如下
复制
总定投资金: 71600.0
总持仓股数: 0.2997135690443538
最终持仓价值: 1150.9697285924076
收益率: 5.82%整个程序使用了baostock提供数据,pandas为数据提供标准格式,便于分析,matplotlib用来绘制图表(如图一),如果不需要图表可以不要它。
注意:本文仅对过往数据进行测试研究,不做任何投资建议!


评论 (0)